Transforming Graphs In Algebra

Graphs are useful tools. We use them to show a lot of information visually. In this article, I want to show how functions are transformed in graphs.
Introduction
We can shift functions in many ways on a graph. This is important to understand so you can accurately model a function when you need to. They can be shifted left, right, up, down, and even stretched.
- f(x) + c =graph is shifted upwards
- f(x) — c =graph is shifted downwards
- f(x + c) =graph is shifted to the left
- f(x — c) =graph is shifted to the right
- -f(x) =graph is reflected across the “x” axis
Shifting Up And Down
This is your typical parabola. In this form its vertex is at (0,0).
It looks like this when you graph it.

When we shift it, we are moving the whole curve in some direction.
When we want to shift it upward, we can rewrite the equation as:
\[f(x) = x² + 3\]
Here is the graph that shows the function shifted upward by 3 units above the “x” axis. You can see the vertex and whole curve is shifted upwards by 3 units. That is what the constant does in the equation above.

It works the same way when you want to shift it downward.
\[f(x) = x² — 3\]
As you can see, the vertex is 3 units below the “x” axis now.

These movements of the function are called horizontal and vertical shifts. They just adjust the position of the function on the graph.
In fact, we can build the graph from the function. This is helpful when we want to graph an equation to better understand it. That is an important idea later in mathematics.
Shifting Left And Right
You can also adjust the position of a function left or right of the “y” axis. We accomplish this by modifying the variable of the function.
\[f(x) = (x-3)²\]
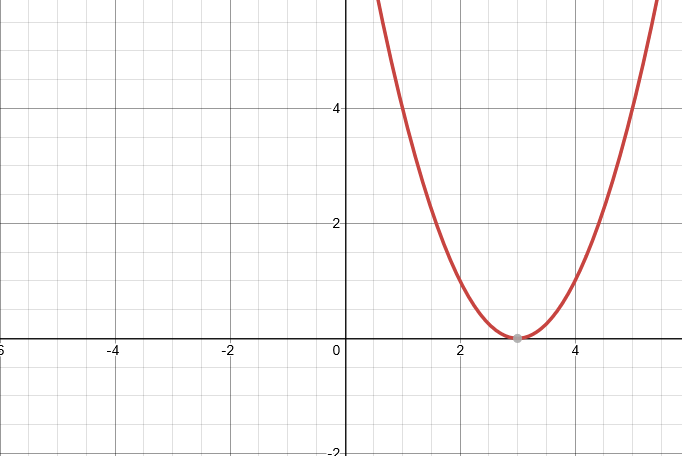
This will shift the function to the right of the “y” axis by 3 units. So far, everything is still on the “x” axis, but we can change that too.
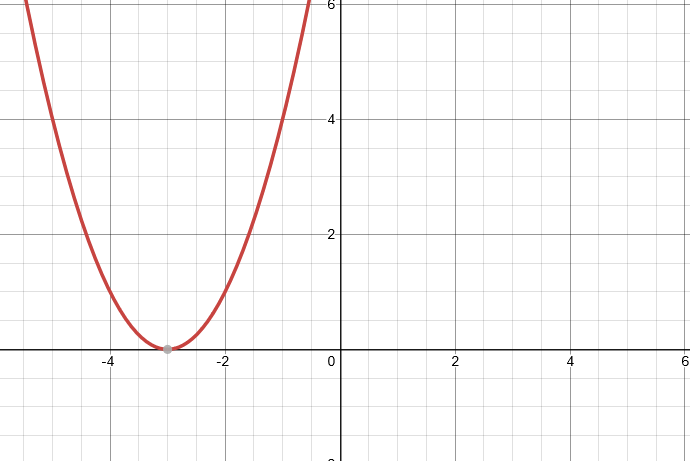
You can do the same process to shift the function to the left.
\[f(x) = (x+3)²\]
We know these as horizontal shifts. They can be combined with any other type of transformation.
Combining Shifting Methods
Combining the methods that we have already discussed is very useful. Let’s shift this function up and left on the graph.
\[f(x) = (x+3)² + 3\]
Here is the corresponding graph.
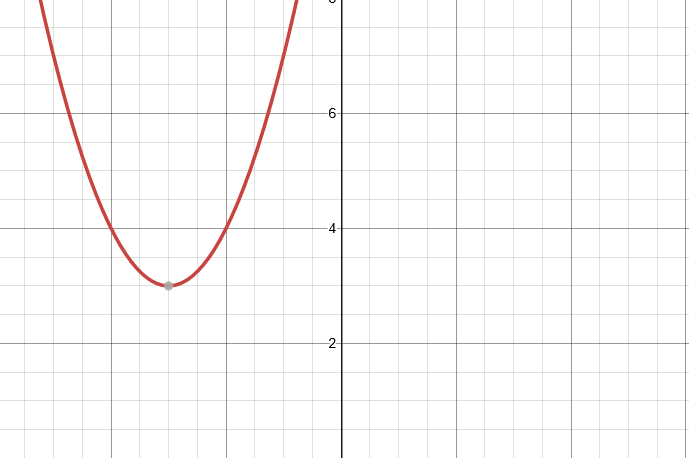
The constant moves the graph upward 3 units, while the “x” variable is modified by +3 in order to move the graph left by 3 units.
We can do the opposite and shift the function downward and to the right.
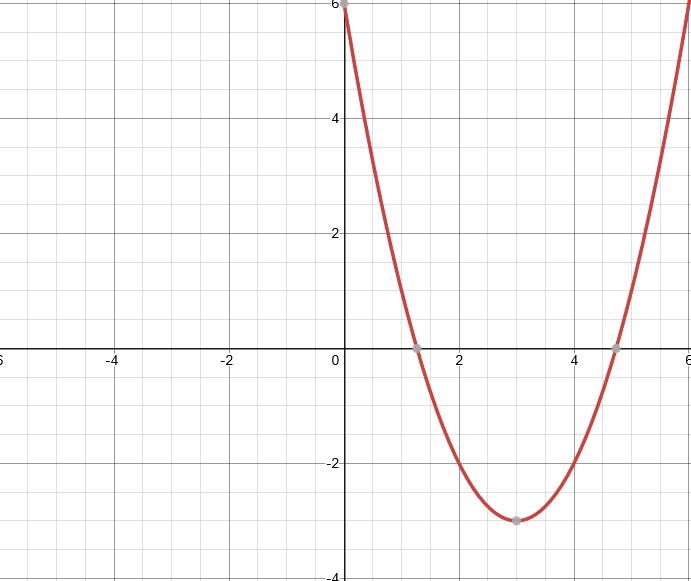
\[f(x) = (x-3)² -3\]
Here is the graph for that combination of shifting. The is kind of the opposite of the previous example. The constant (-3) moves the graph downward by 3 units. Then the “x” variable is again modified by the (-3) in order to move the graph to the right.
Stretching A Function
We can manipulate functions in a variety of ways. Stretching a function is another way. This done by adding a coefficient in front of the function. Behavior is a little less intuitive. The reason why is that it depends on the function itself.
Playing with the coefficient in front of the function will stretch a function along the “y” or “x” axis. It depends on the coefficient. Generally, a positive coefficient will stretch a function along the “y” axis. Conversely, a coefficient less than 1 will stretch it along the “x” axis. You should experiment with your graphing software to see how the main functions are affected.
\[f(x) = x³\]
This is our typical cubic function. Now let us add coefficients in front of it to see what happens.
\[f(x) = 10x³\]
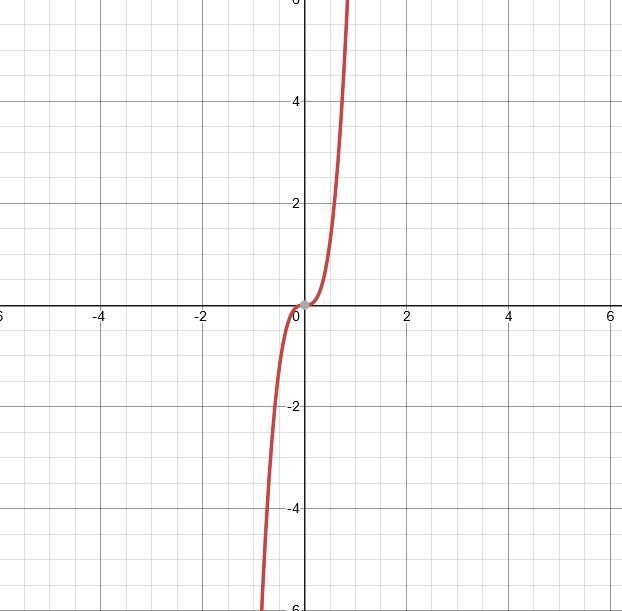
See how it gets narrower? It is being stretched along the “y” axis. It is thinner overall and hugs the “y” axis even closer than before. Now let’s do another.
\[f(x) = \frac{1}{10}x³\]
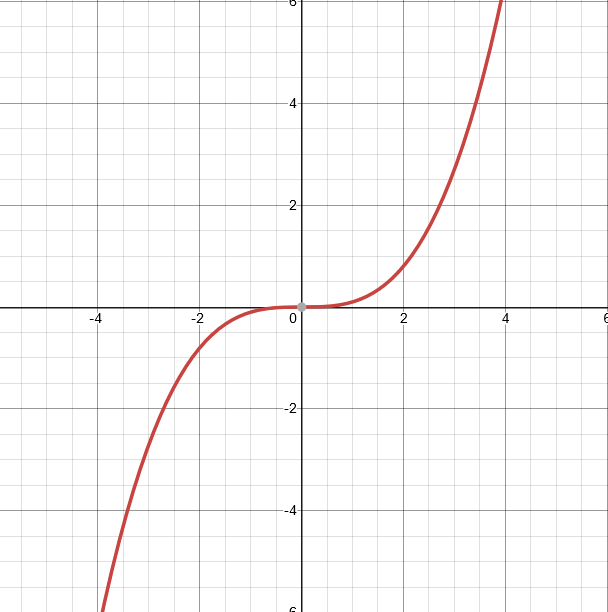
This example widens our function a lot. It is being stretched along the ‘x” axis. This is because of the coefficient that is less than 1. The small the coefficient, the wider this graph gets.
Reflection Of Graphs
Reflecting graphs can also be done. We accomplish it by applying a negative to the original function.
When you reflect across the “x” axis, it is -f(x). Whatever is inside this function will have the opposite sign and value. This is how everything gets translated across perfectly
We can take our function:
\[f(x) = x³\]
Then, to reflect it across the “x” axis, we would apply a negative to the function as a whole.
\[-f(x) = -(x³)\]
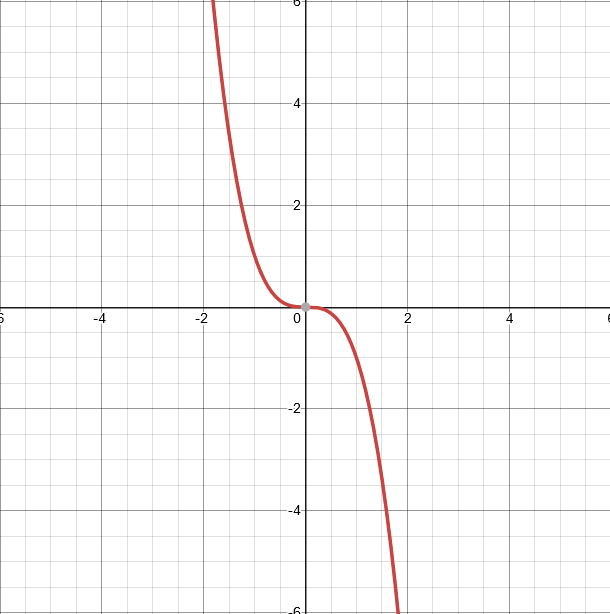
We can see what is happening here because it is the opposite of the regular graph.
Conclusion
In this article, we have talked about the transformation of graphs. Basic transformations include shifting upward, downward, left, and right. We can also stretch a graph along the “x” and “y” axes.
We also talked about stretching and reflecting graphs. These are all important, and together, let us build a graph from equations.
Thanks For Reading
Thank you for reading this, I really appreciate it.
If you would like to join my newsletter, you can do so here.
If you are looking for other articles to read, you can try these:
Originally published at https://sciencebyjason.com on July 2, 2021.
